
Litecoin (LTC) has been displaying an intriguing price pattern against the USDT (Tether) pair. An ascending triangle formation has emerged on the LTC/USDT chart, suggesting the potential for a breakout in the near future.
In this article, we will analyze the technical indicators and key levels to provide insights into the possible direction of Litecoin’s price movement.
Understanding the Ascending Triangle Pattern:
An ascending triangle pattern is a bullish continuation pattern typically formed during an uptrend. It consists of a horizontal resistance line and a rising trendline.
As the price approaches the horizontal resistance, it creates a series of higher lows, indicating buying pressure. The pattern suggests that buyers are gaining strength and could eventually push the price above the resistance level, leading to a breakout.
LTC/USDT Price Analysis:
Currently, Litecoin is trading within the boundaries of the ascending triangle pattern against USDT. The resistance level is around $152, while the rising trendline is around $140. As the price approaches the apex of the triangle, it indicates a potential breakout point.
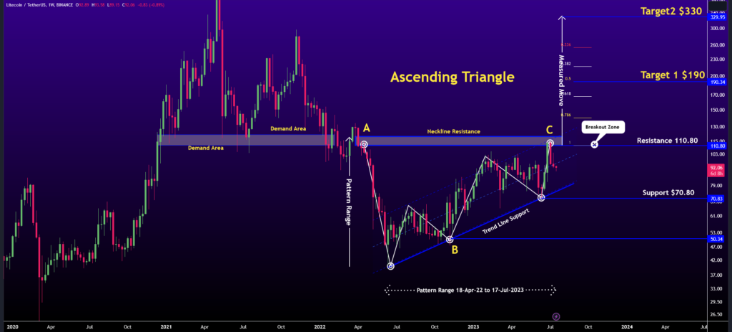
Key Levels to Watch:
- Resistance: The critical resistance level to monitor is around $152. If Litecoin manages to break above this level convincingly, it could signal a bullish trend continuation.
- Support: The rising trendline acts as support, currently around $140. If the price fails to hold this level, it may test lower support levels around $135 and $130.
Technical Indicators:
- Relative Strength Index (RSI): The RSI is currently hovering around the mid-level, indicating a neutral stance. A break above 50 could suggest bullish momentum, while a drop below 50 might indicate bearish pressure.
- Moving Averages: The 50-day and 200-day moving averages can provide additional support and resistance levels to monitor. If the shorter-term moving average (50-day) crosses above the longer-term moving average (200-day), it could signal a bullish signal.
Potential Breakout Scenario: If Litecoin breaks above the resistance level at $152, it could lead to a bullish breakout, with the price potentially targeting the next resistance levels at $165 and $180.
However, if the price fails to break above the resistance and drops below the rising trendline support, it may experience a bearish breakdown, with potential support levels at $135 and $130.
If you are considering investing in LTC, it is important to do your own research and understand the risks involved. Cryptocurrencies are a volatile asset class, and there is no guarantee that LTC will reach the price predicted in this article.
James Wilson is a crypto writer and researcher with over 5 years of experience in the industry. He is a graduate of the University of California, Berkeley, where he studied computer science and economics. After graduating, he worked as a software engineer at a major tech company before transitioning to a career in crypto.
Related posts
Pixelverse Announces Play-to-Airdrop Campaign with 10 Million $PIXFI Token Distribution

Financial Freedom Unlocked: “Investing, Crypto, and Financial Freedom” Becomes a Bestseller

Liquid Mercury Partners with GFO-X to Provide RFQ Platform for Trading Crypto Derivatives